Renewable Power Production
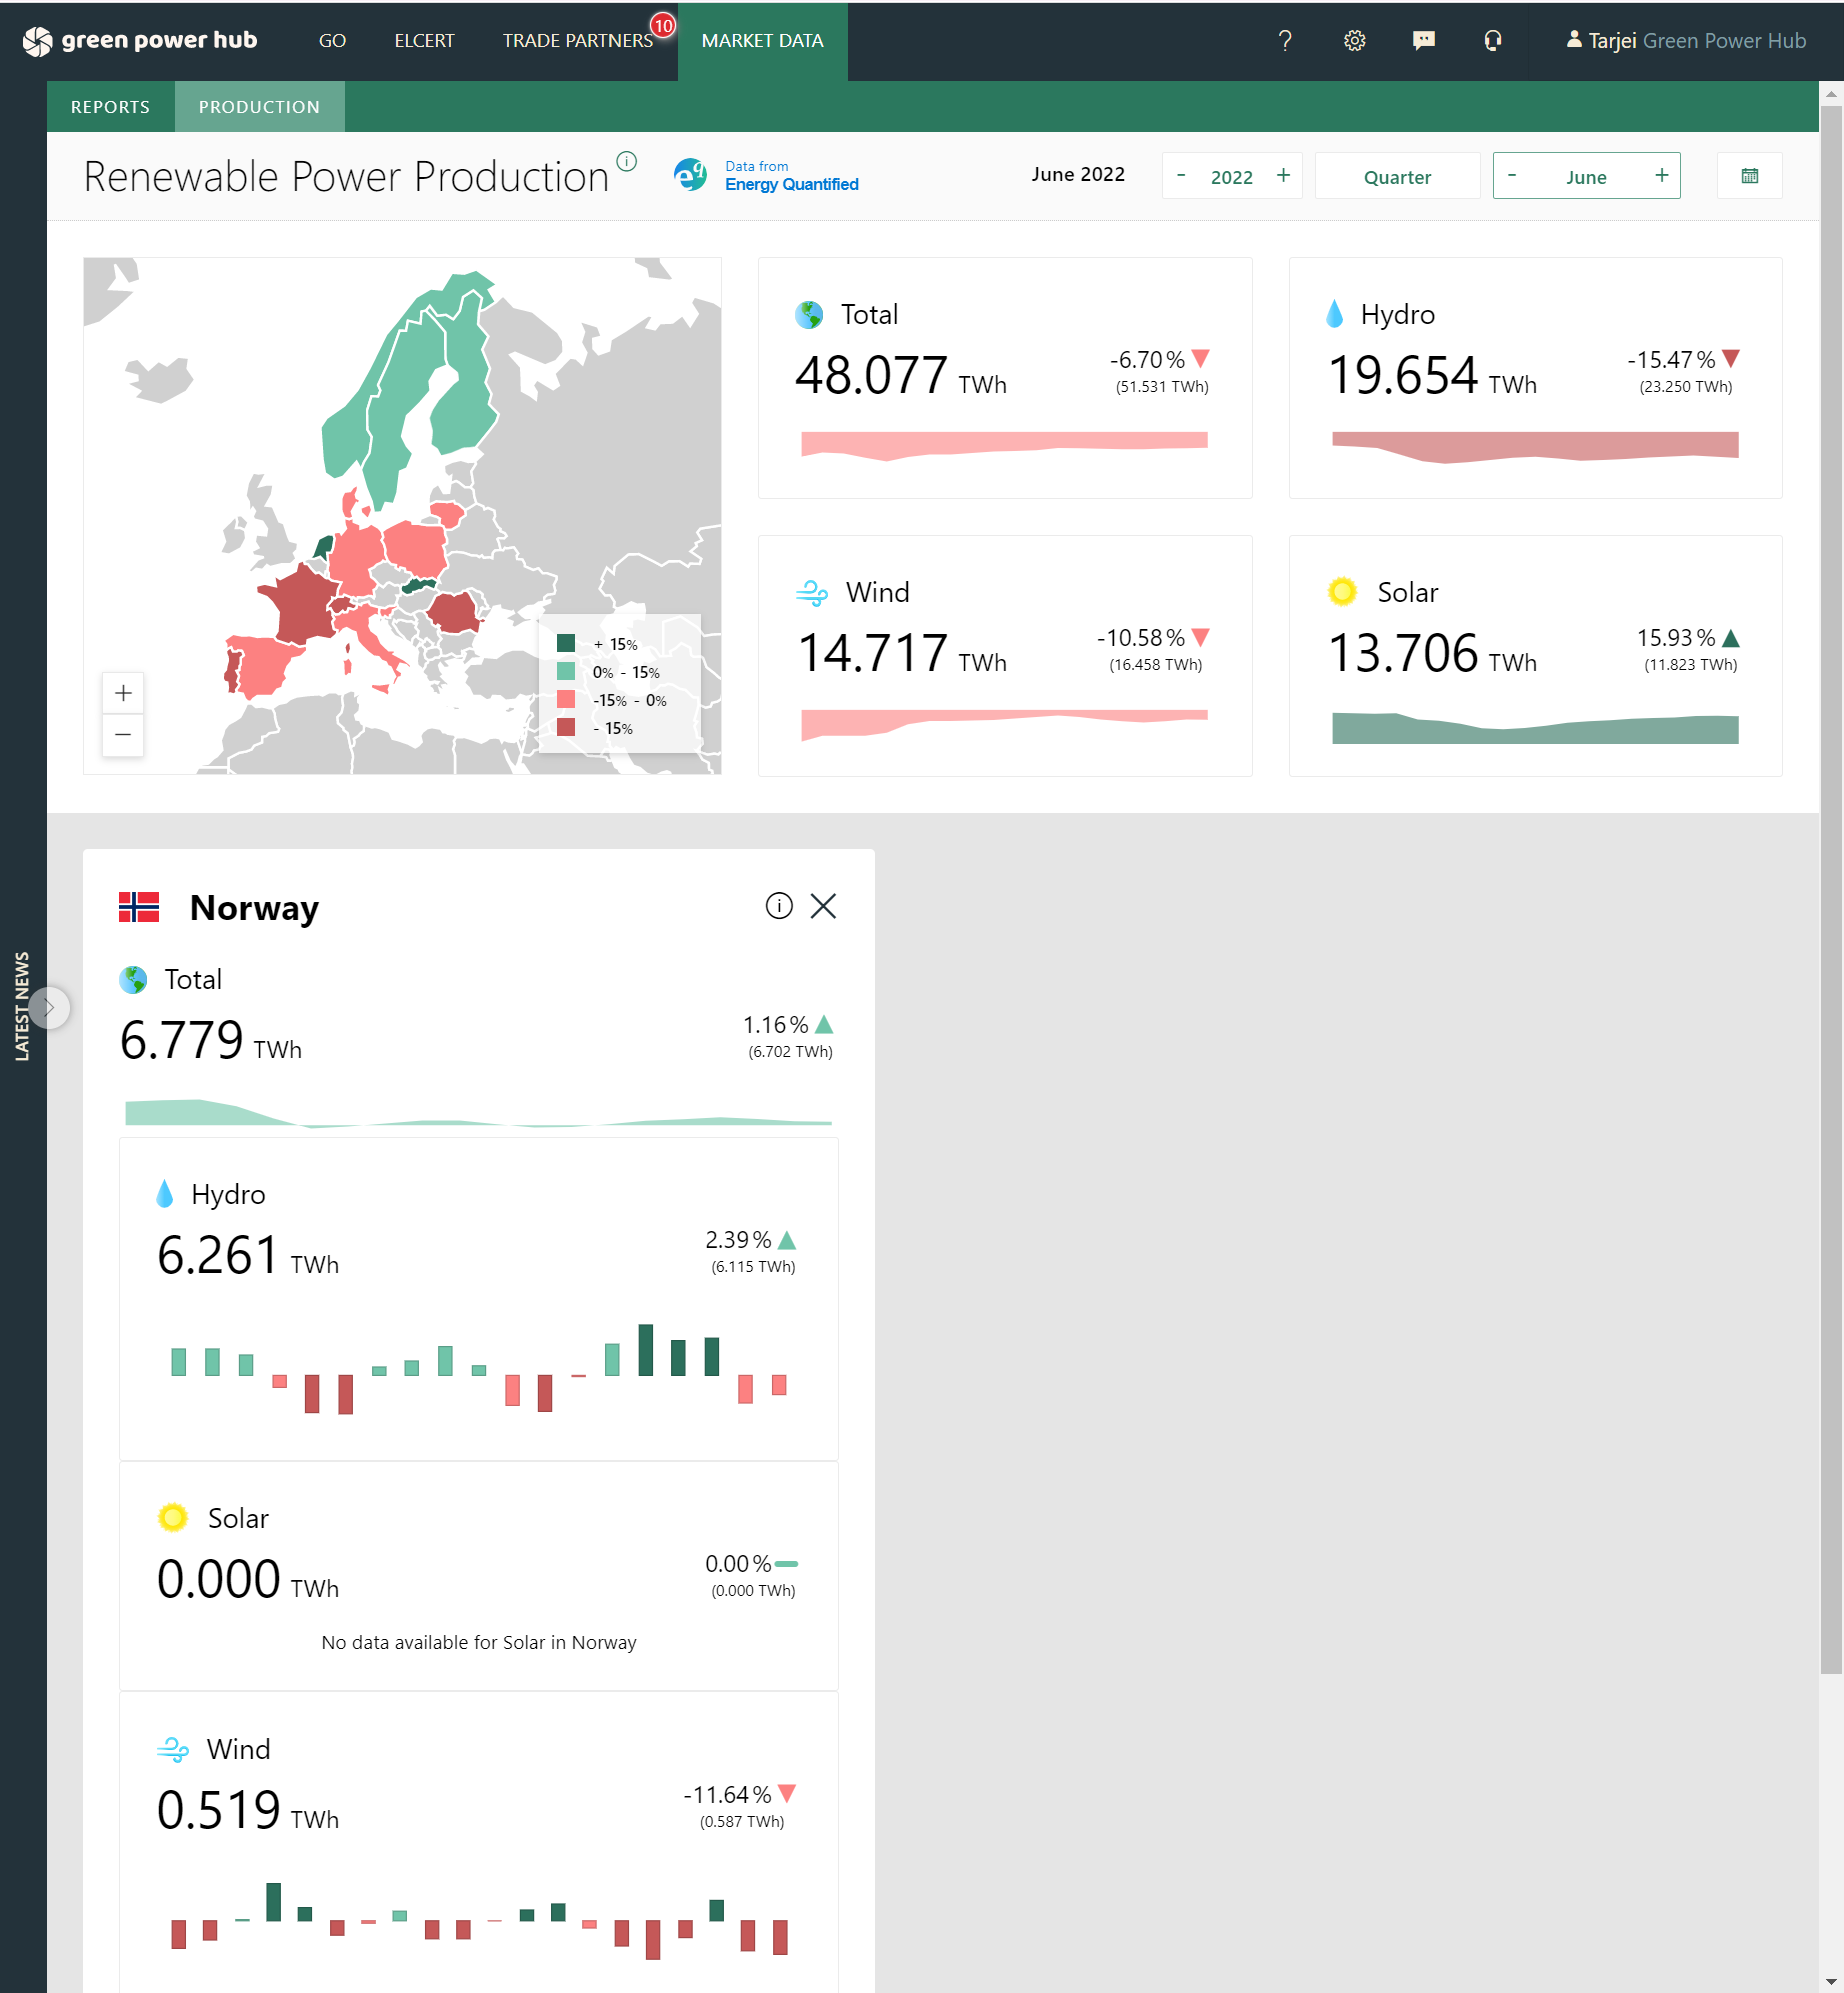
Visualize the renewable power production in the GreenPowerHub application. Production data include Hydro, Wind, and Solar from 10+ European countries.
Visualize the renewable power production in the GreenPowerHub application. Production data include Hydro, Wind, and Solar from 10+ European countries.
By default, you see the current month’s data. The map gives a quick overview of the production status.
Green indicates a higher production than last year’s period, while red indicates a lower production.

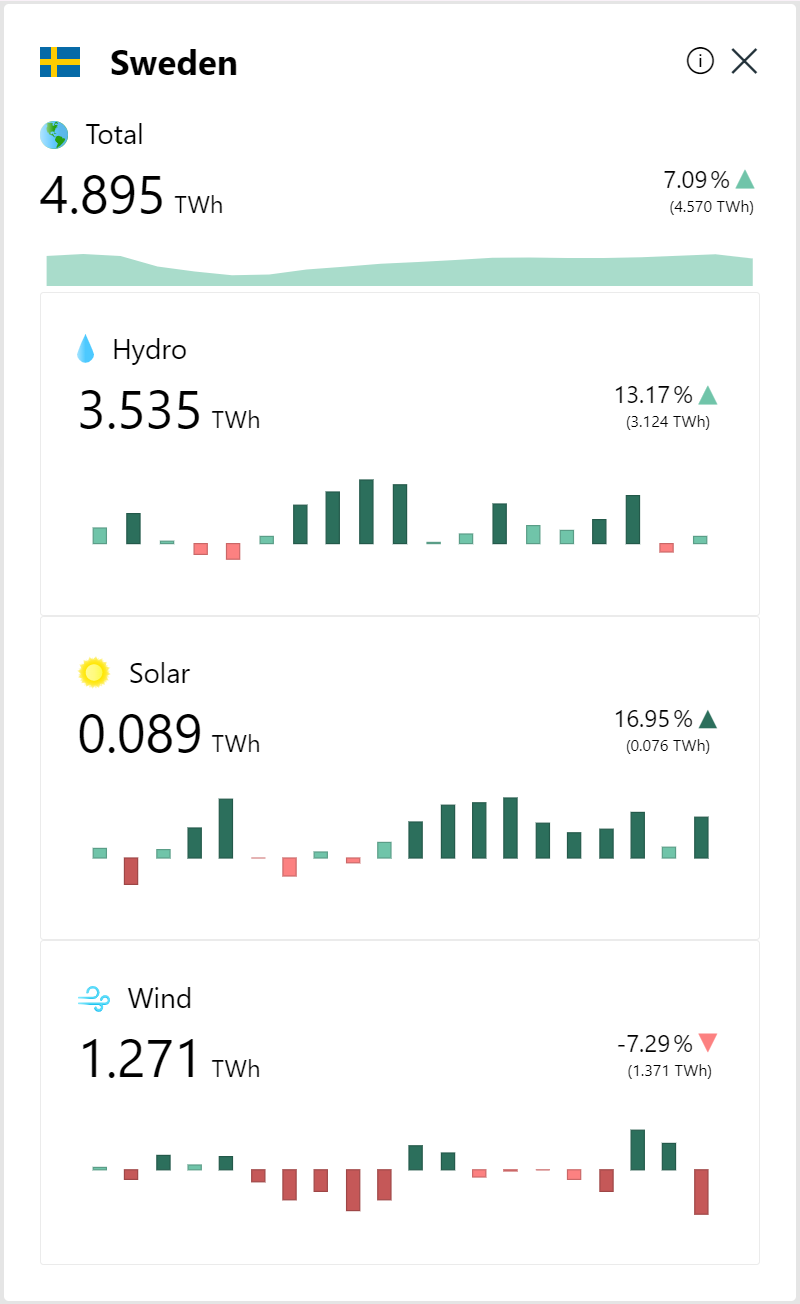
Clicking a country on the map opens a box below with specific production statistics for that country.
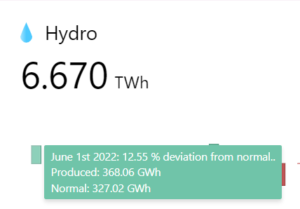
Hover the visualization to see extra information.


You can set the date period in the upper right corner.

The renewable power production is powered with data from EnergyQuantified.